PromQL over offline metric dumps
- The problem
- Why PromQL?
- The prototype
- Making it production ready
- Parquet specifics, for the nerds
- Conclusion
A few months ago, on the first day of a "breather week" (a week we get every few
quarters at Cockroach Labs to step away from our usual work and build whatever we
want), I set out to do something that sounded slightly ridiculous: make a static
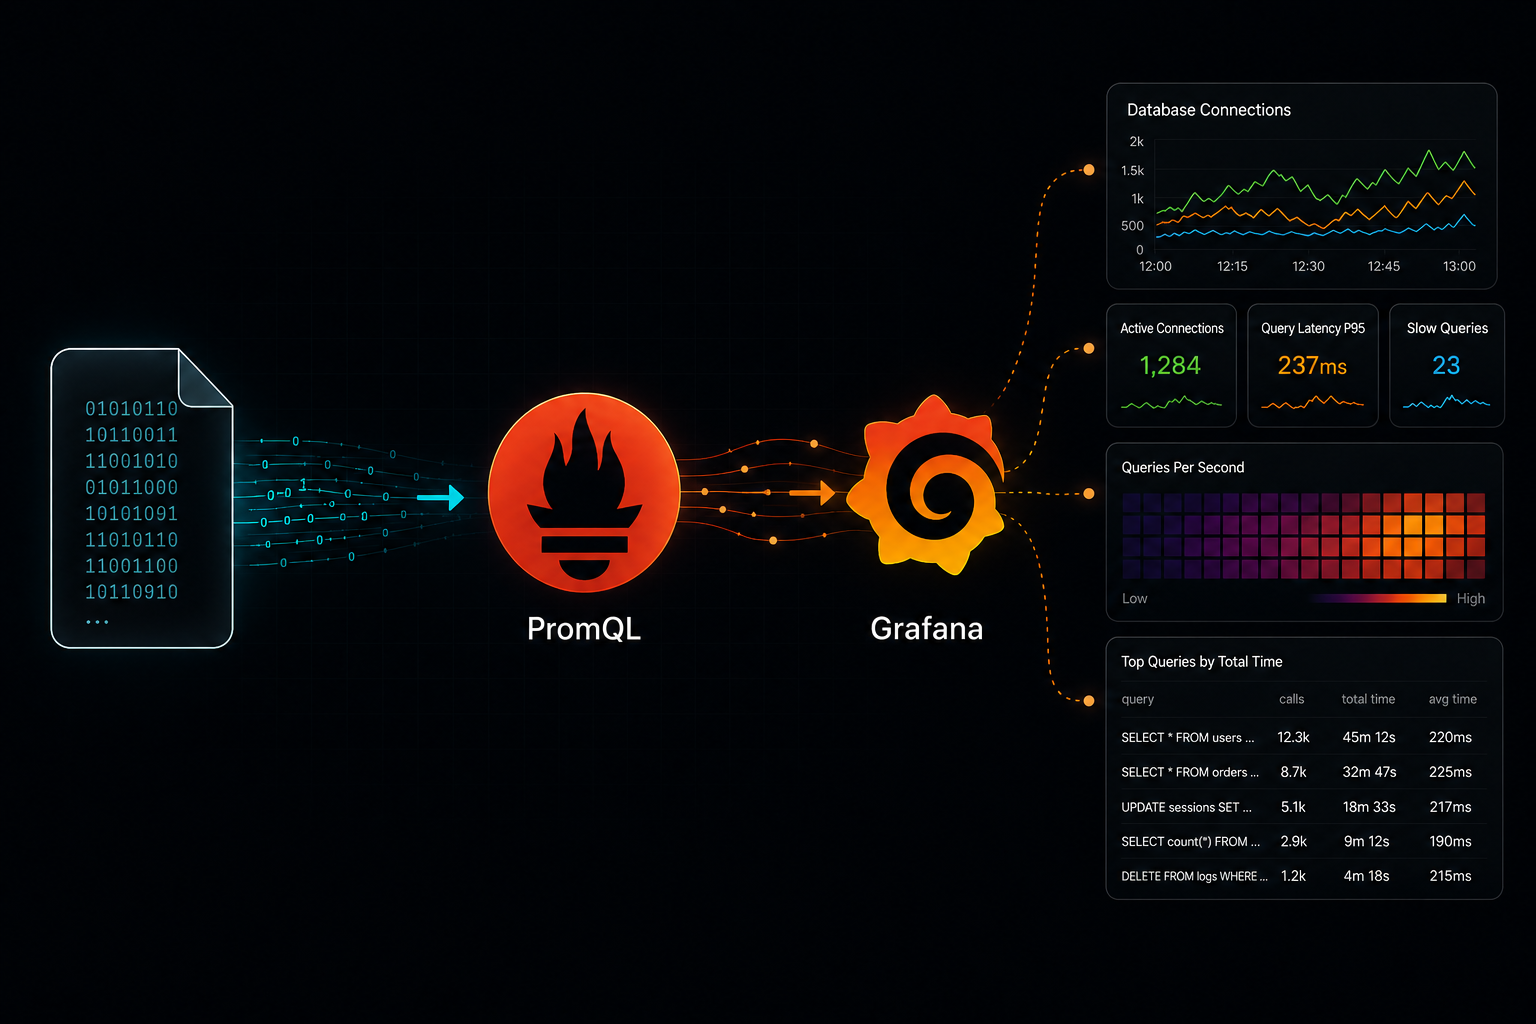
file full of database metrics answer PromQL queries. By the end of that day I was scrolling through a
customer's cluster metrics in Grafana, panning, zooming, running rate(),
against data that had been sitting frozen in a file on my laptop. This is the
story of how that came together.
The problem
At Cockroach Labs, our self-hosted customers run CockroachDB in their own environments. When something goes wrong, they hand us a tsdump, a static, point-in-time export of the time-series metrics from their cluster. It's a snapshot. No live scraping, no running Prometheus, just a file.
These files are all over the map in size. A small cluster might produce a few hundred megabytes. A big, busy one produces several gigabytes. I've personally seen one hit 40GB. And unlike the metrics in a live monitoring system, this data is often days or weeks old by the time it reaches us, which is exactly the kind of historical data that most observability SaaS platforms handle worst.
Getting a tsdump into something like Datadog is technically possible, but it's death by a thousand rough edges. And historical ingest isn't cheap either. None of the off-the-shelf paths felt like they "just worked" for a support engineer who needs answers now, during an active investigation.
At the same time, we'd started building agentic workflows to help investigate cluster issues, using artifacts like these tsdumps. So I actually had two problems to solve at once:
- I needed a way to query these files locally, fast.
- I needed an interface that "just works" with AI agents, and ideally plugs cleanly into the standard observability tooling everyone already knows.
During one of these breather weeks, I had the crazy idea to make these tsdumps work with PromQL. I wasn't sure how it was going to work, but I thought it would be a fun challenge, and it would solve both of the objectives above really well.
Why PromQL?
PromQL is very widely used. It's basically the industry standard for querying time-series data. The built-in functions are powerful and ergonomic, so you can express a lot with very little.
More importantly, it has a rich ecosystem of observability tools that understand PromQL natively. Grafana being the obvious one. So if this worked, I could potentially visualise the metrics from a tsdump in Grafana.
And on the practical side, there are a couple of PromQL parsers out there in Golang, so I wouldn't have to write one from scratch.
The prototype
I started by digging into the Prometheus codebase to understand how PromQL is parsed and executed, hoping I could rip off some of that code as-is. To my pleasant surprise, I didn't have to rip anything off. The whole PromQL execution engine is built in a very modular way, and it can just be imported as a library. You hand it a query string and a storage backend, and it does the rest.
That shaped the whole plan. I'd have an HTTP server that receives PromQL queries, passes them to the query engine, and the engine reads the tsdump file and serves the results back. First I whipped up the logic to decode tsdumps. These were already in a protobuf format, so it was pretty straightforward. Then a very simple HTTP server using the Go standard library.
The interesting part was wiring the engine to my data. The engine reads
time-series data through a storage interface. The top-level one is
storage.Queryable,
which hands back a
storage.Querier:
// From the Prometheus codebase.
type Queryable interface {
	Querier(mint, maxt int64) (Querier, error)
}

type Querier interface {
	LabelQuerier
	Select(ctx context.Context, sortSeries bool, hints *SelectHints, matchers ...*labels.Matcher) SeriesSet
}
So all I had to do was tweak my decoding logic to satisfy this interface. Select
gets the label matchers and a time range, and returns the matching series. My
implementation just decodes the tsdump and hands back whatever matches:
type tsdumpQuerier struct {
	// ...
}

func (q *tsdumpQuerier) Select(ctx context.Context, sortSeries bool,
	hints *storage.SelectHints, matchers ...*labels.Matcher) storage.SeriesSet {

	// decode the dump, filter by matchers + time range,
	// group samples into series, and return them.
	return newListSeriesSet(series)
}
And that was it. I created the engine with
promql.NewEngine,
handed it my querier via
NewInstantQuery
/ NewRangeQuery,
and I had a working prototype that could answer PromQL queries against a tsdump.
Yes, this was a very rough prototype. It had to decode the tsdump serially for every single query. But it was working end to end. I made the HTTP server Prometheus compatible by adding the endpoints that Prometheus exposes, so it could pretend to be a real Prometheus server. Then I configured it as a Prometheus data source in Grafana, and to my delight, I could visualise every single metric from the tsdump.
And this was just day 1 of the breather week :)
Making it production ready
The rest of the week was about turning this rough prototype into something I'd actually trust during an incident. My definition of production ready was short:
- It should work seamlessly with Grafana, as if it were native Prometheus.
- Queries should be fast enough to be usable while seriously investigating a production incident.
That's it.
Fooling Grafana
I took it step by step. First I looked into how Grafana actually talks to Prometheus. It's all over HTTP, and it turns out Grafana hits several different endpoints, not just the query one. So I ran Grafana, ran a query, and opened the network tab in the browser to watch. Then I listed down every endpoint it hit, figured out the point of each one, and implemented them all in my server.
mux.HandleFunc("POST /api/v1/query", ps.handleQuery)
mux.HandleFunc("POST /api/v1/query_range", ps.handleQueryRange)
mux.HandleFunc("GET /api/v1/labels", ps.handleLabels)
mux.HandleFunc("GET /api/v1/label/{name}/values", ps.handleLabelValues)
mux.HandleFunc("GET /api/v1/series", ps.handleSeries)
mux.HandleFunc("GET /api/v1/metadata", ps.handleMetadata)
mux.HandleFunc("POST /api/v1/read", ps.handleRead)
Once these were in place, Grafana could no longer tell that it wasn't talking to a real Prometheus. Which meant all the nice things came for free: metric discovery, auto-complete, label discovery, all of it just worked.
Making it fast
Query performance was the harder half. Decoding the whole tsdump serially on every query was never going to be practical. But neither was decoding the entire thing into memory up front, because these files are just too big.
What I needed was an index: something that could tell me where in the file a particular metric lived, and how many data points I'd have to scan for it. My first attempt was an indexer that did a single scan at startup and built this index in memory. It worked well-ish. But it capped how many tsdumps a single server instance could hold, and honestly, the vibe-coded indexer was pretty sloppy.
Around this time I kept hearing people at work talk about the Parquet format. I looked into it, and it was a perfect fit:
- It's a columnar format.
- It has a built-in metadata store that can be used as an index.
- It has a rich ecosystem of libraries in many languages.
A teammate wrote a converter that turns a tsdump into Parquet, so all I had to do was tweak my decoding logic to read from Parquet instead of the raw tsdump. This conversion happens once, when the tsdump is first received.
Now a query no longer had to touch the whole file. It could look at the metadata store, find exactly where the relevant metric lived, and read only that slice. Query time stopped scaling with the size of the whole dump. On some testing, I was seeing sub-200ms latency on tsdumps that were 5GB and larger.
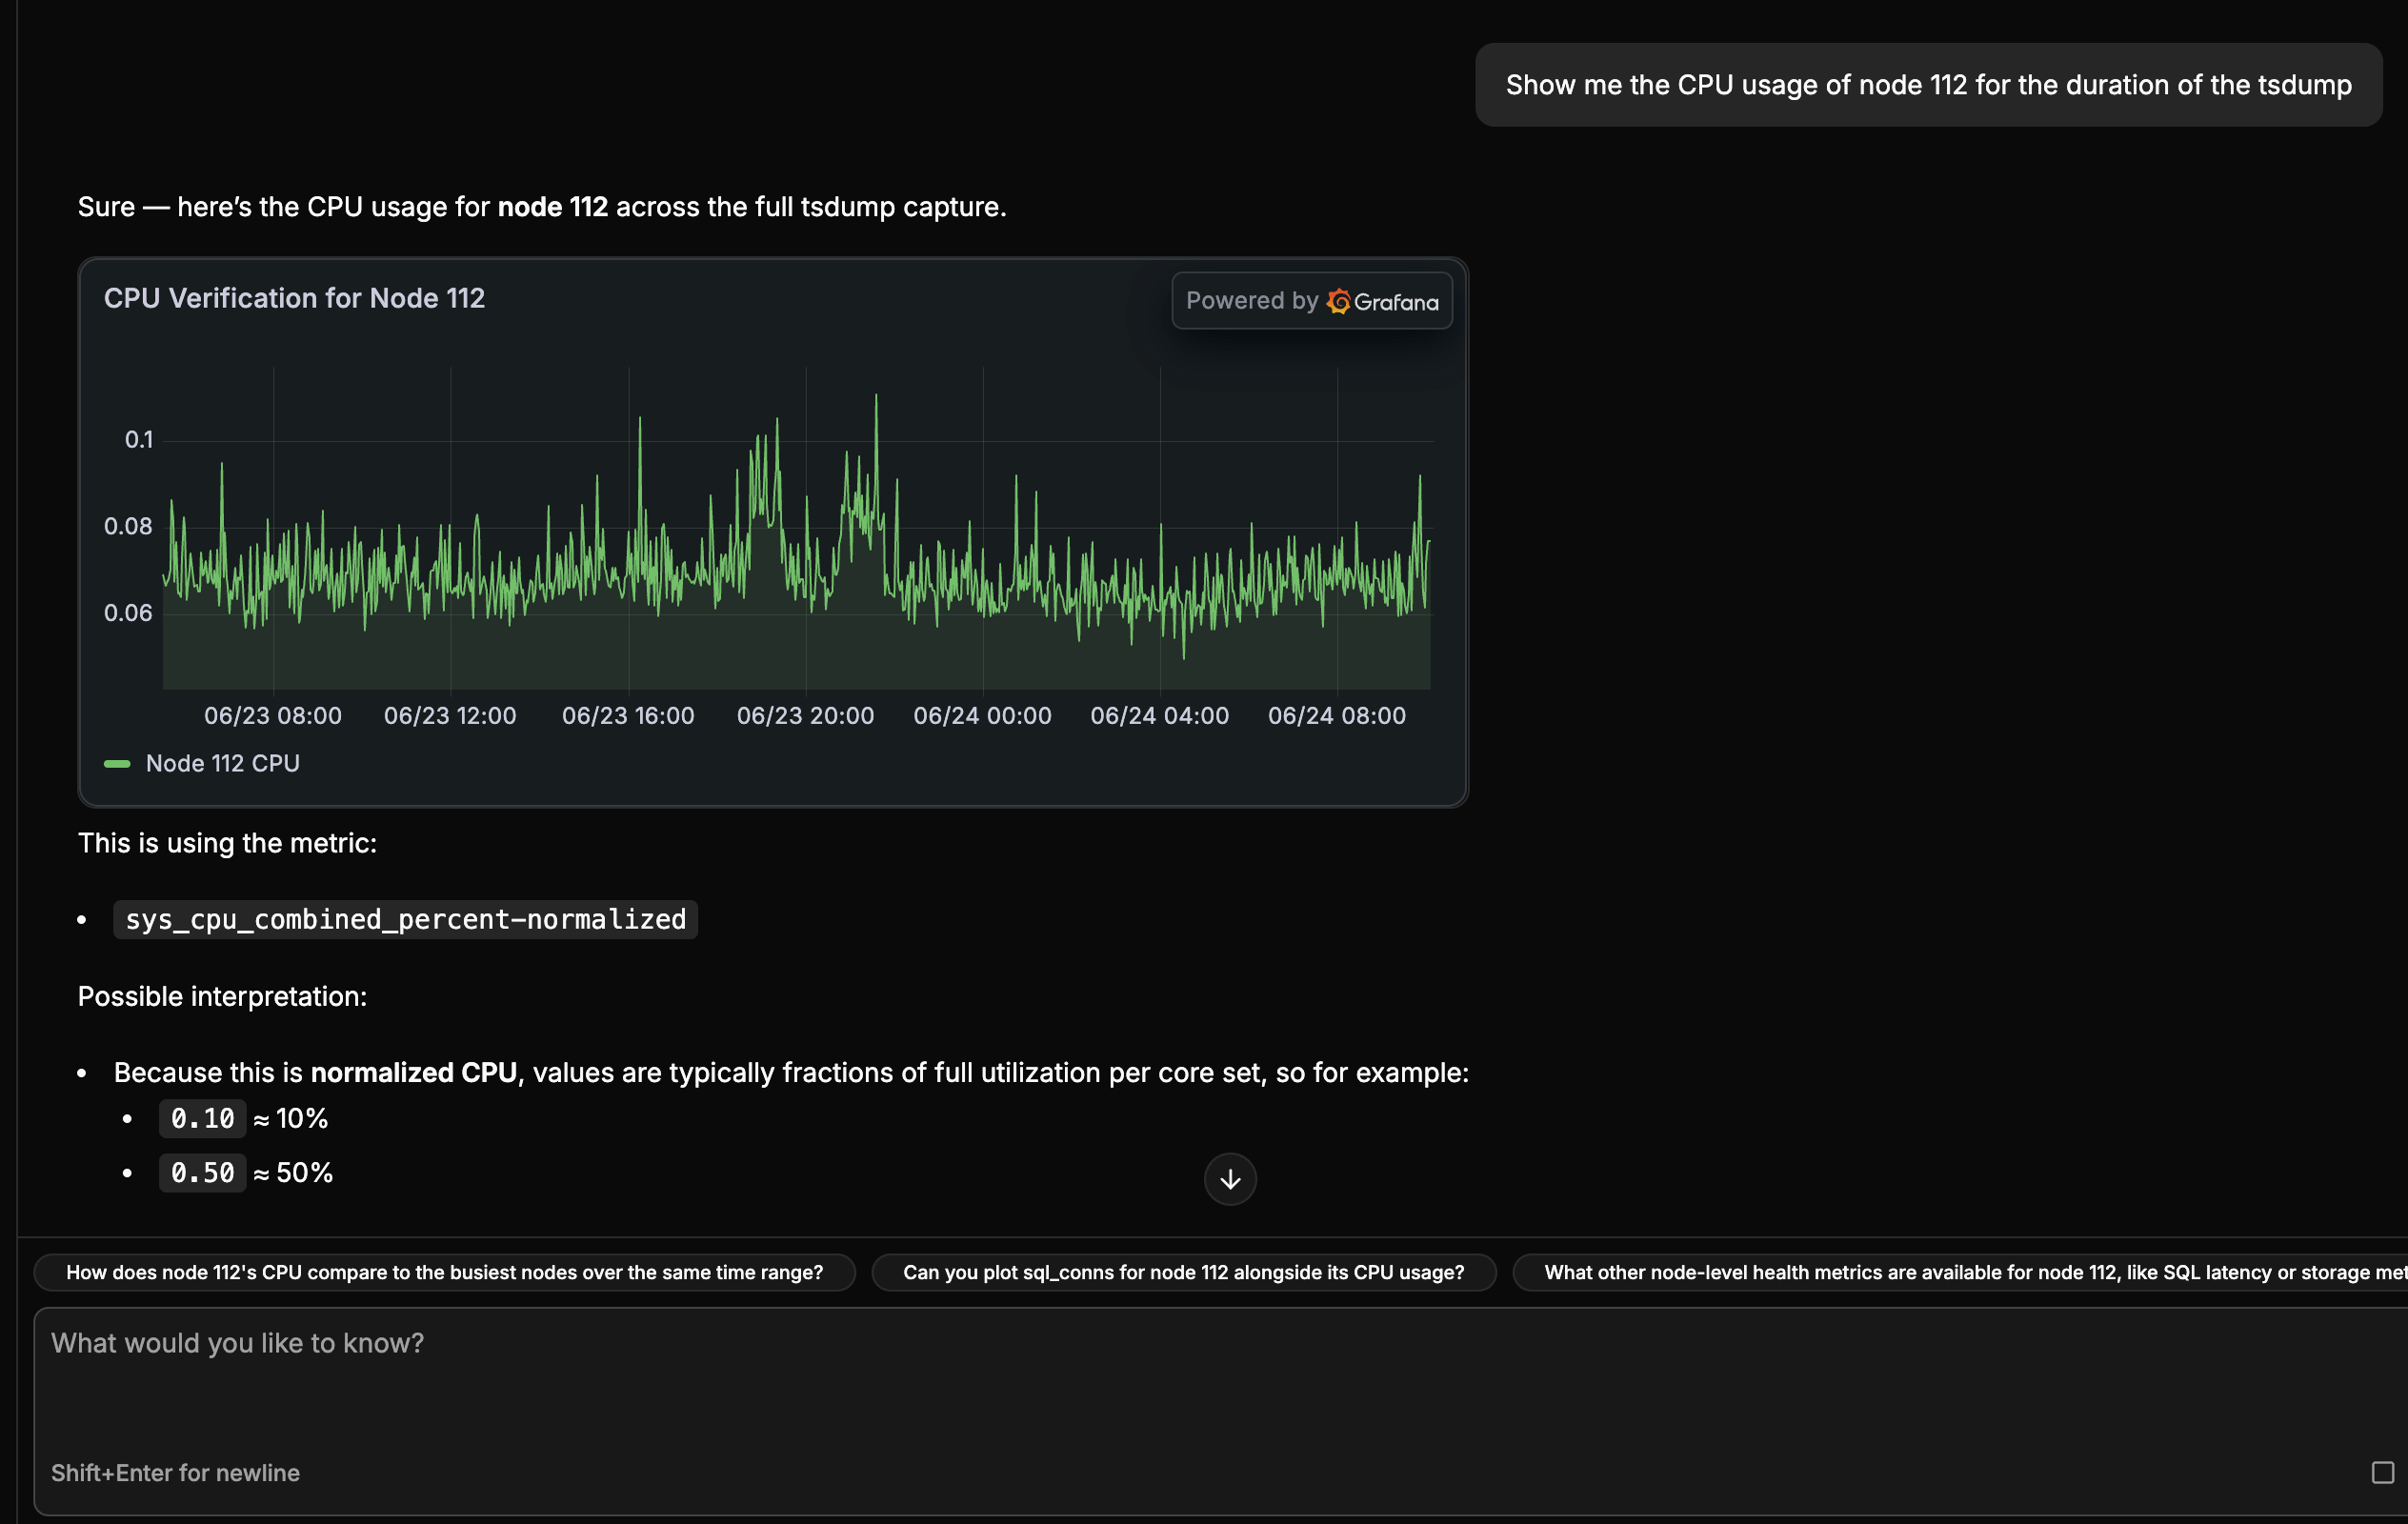
This was ready. I integrated it into our support platform, and then built AI agent tools that could talk to Grafana and render charts natively in the chat interface. So a user can now ask something like "show me the CPU usage of node 112 for the duration of the tsdump", and the agent queries it through Grafana and renders the chart right there in the chat, in an iframe. It looked beautiful.
The full picture
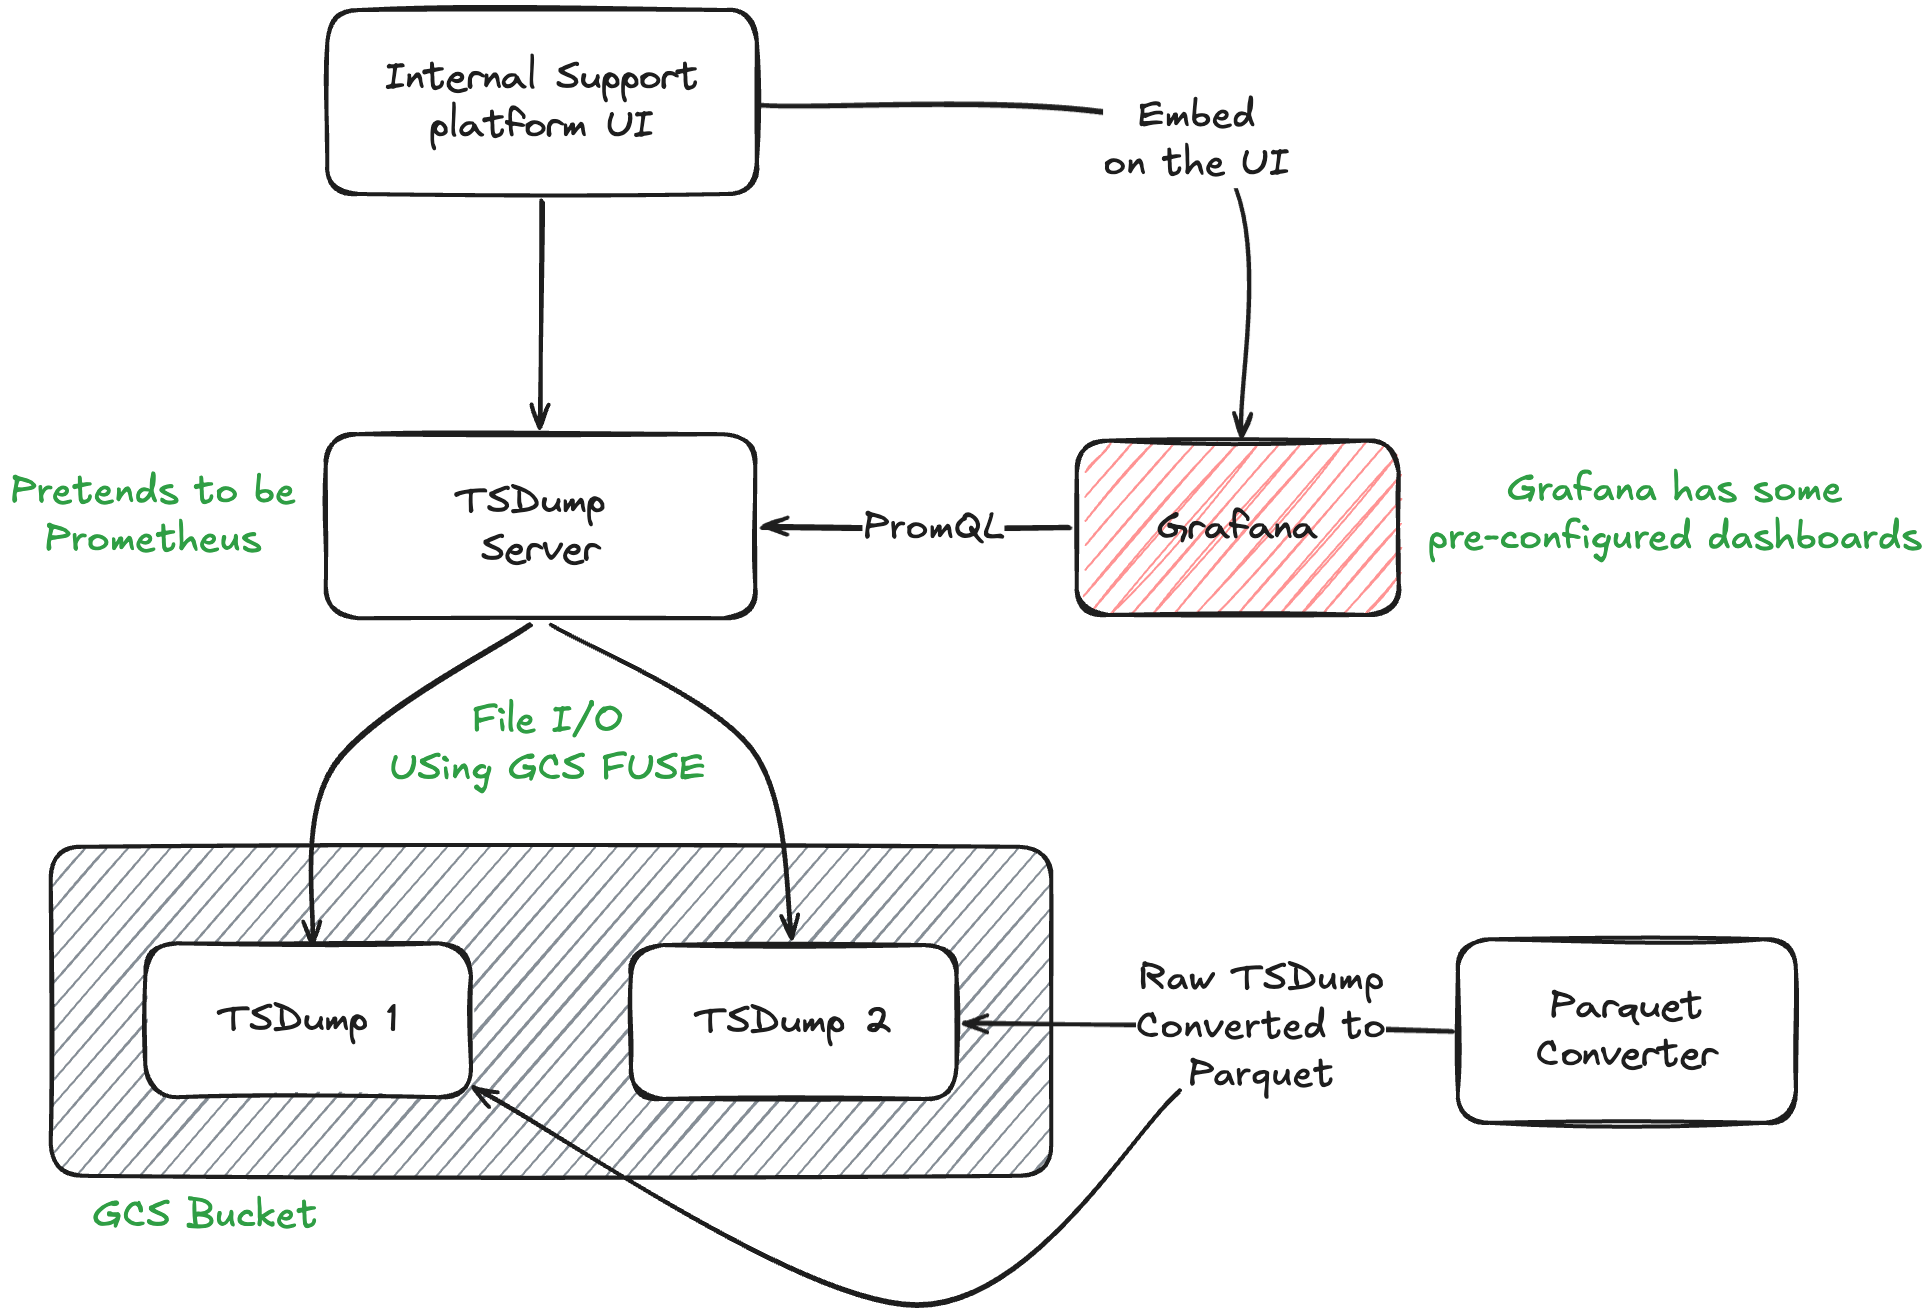
Here's how the whole thing fits together. The tsdumps get converted to Parquet once and land in a GCS bucket, which is mounted as a file system on the server's compute using GCS FUSE, so the server can just read the files off disk. The server pretends to be Prometheus, Grafana queries it over PromQL, and the resulting dashboards get embedded straight into our internal support platform.
Parquet specifics, for the nerds
The layout that makes this fast is worth a closer look. The schema itself is tiny. Every data-point is just a metric name, a source, a timestamp, and a value:
type Row struct {
	Name      string  `parquet:"name,zstd"`
	Source    string  `parquet:"source,zstd"`
	Timestamp int64   `parquet:"timestamp,delta"`
	Value     float64 `parquet:"value"`
}
The important detail is how these rows are grouped on disk. Each metric gets its own row group in the Parquet file.
Row groups are a trade-off. The more row groups you have, the more metadata overhead you carry, but the less data you have to scan for any single query. One row group per metric sits at a nice point on that curve. The number of distinct metrics in a cluster is finite and doesn't grow unbounded, so the metadata overhead stays extremely small, while a query for a single metric only ever has to read that one row group.
Conclusion
This was a genuinely fun project to work on. I'm thrilled that it came together within the week and is now running in production, helping cut down our MTTR. The end result is a tool that lets us query large tsdumps efficiently and visualise their metrics in Grafana.
It also opens up a lot of possibilities for AI agents to interact with these metrics in a more natural way. There are decades of PromQL out there that these agents have been trained on, so speaking the same language works out really well.
This is probably the proudest I've been of any work in my career so far. Going from a crazy idea to a working prototype to a production ready tool in a single week is exactly what I love about this profession.
And honestly, I don't think I would have dared to even attempt this if it weren't for agentic coding. The amount of confidence and courage it gives you is incredible.